

DIY ECG/EKG Electrocardiogram
Background
When it comes to healthcare, timely access to medical services and diagnostic tests can be critical. Unfortunately, in some cases, getting an appointment with a specialist like a cardiologist can take weeks or even months. This was the case for me when I needed an ECG (electrocardiogram) to assess my heart health.
What is an ECG/EKG?
ECG (that stands for electrocardiogram) is a medical test that records the electrical activity of your heart. It’s a fancy way of saying they put stickers on you to see how your heart beats. They check the electric waves, show them on a screen, or plot it on paper. It can tell you some important things about your heart, like how it’s beating and if it’s healthy or not. It can help doctors determine heart problems, like arrhythmias or heart attacks.
I have a hobby of working with electronics
Frustrated with the wait time, I started exploring other options. That’s when I came across the AD8232 ECG module, which can be used with a microcontroller to measure and display ECG data. I decided to order some modules and an ESP32-S3 dev module with an LCD screen (LilyGo T-Display-S3) to start experimenting.
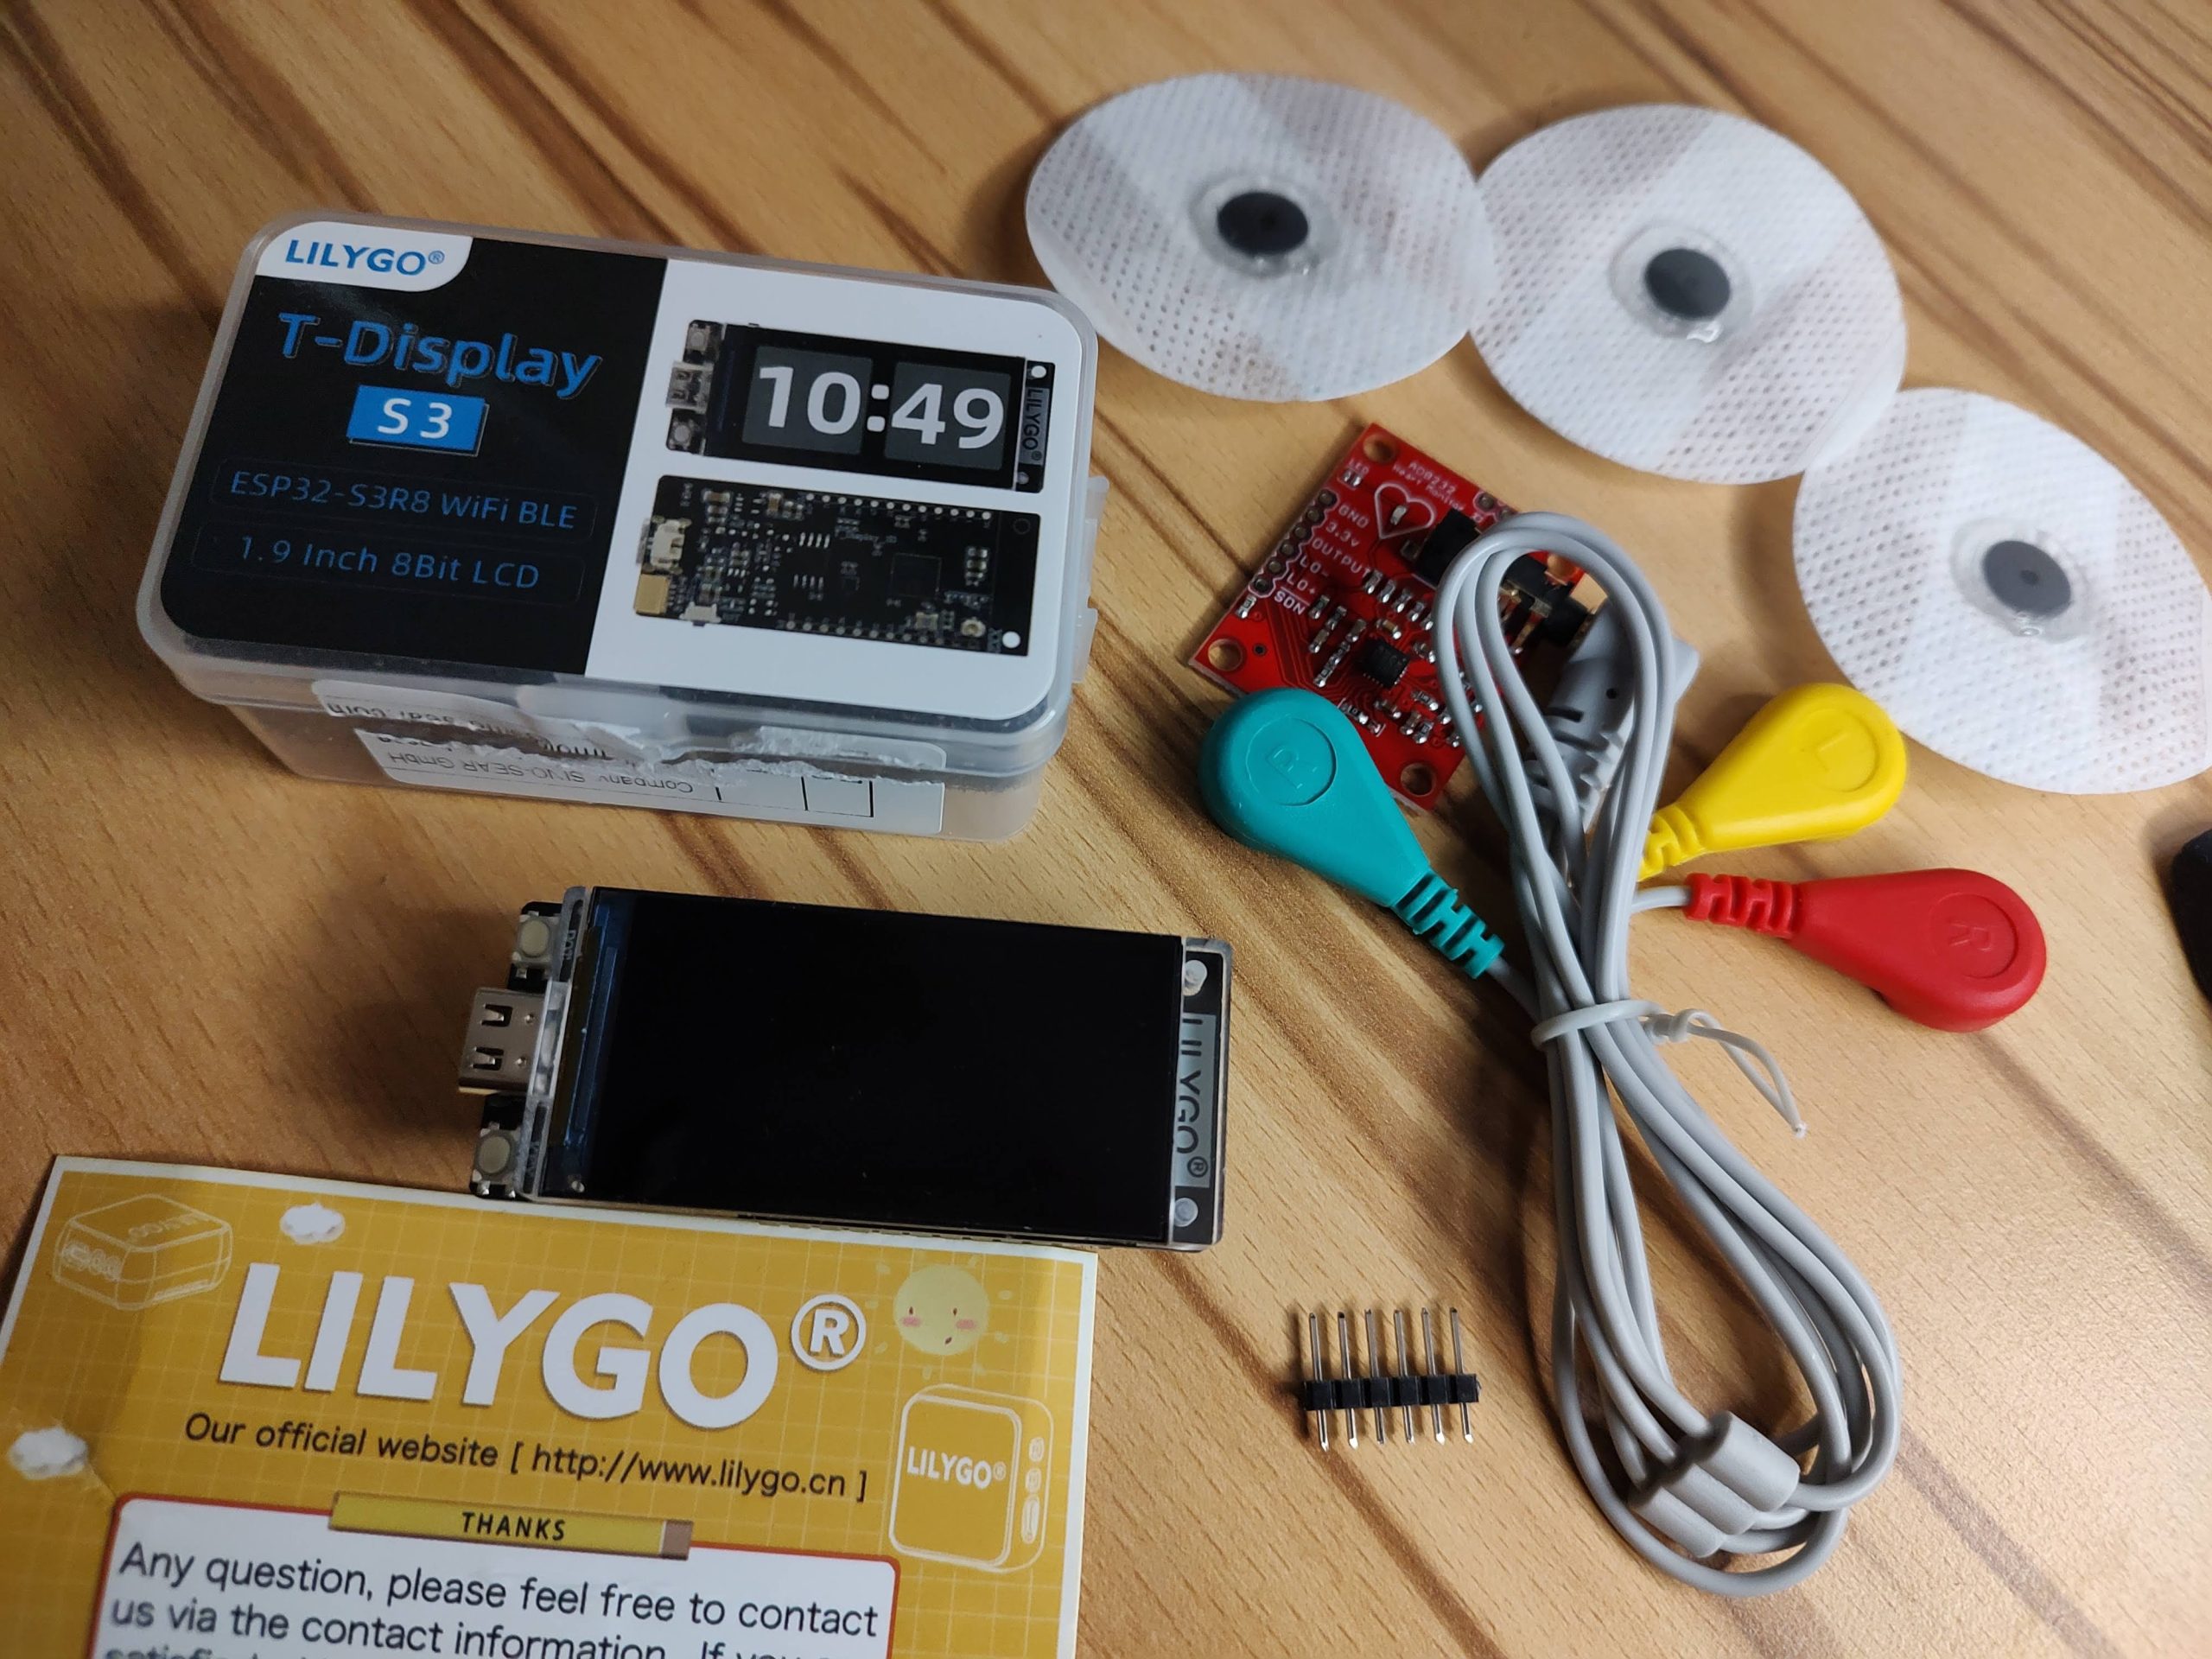
After some tinkering, I was able to build a working ECG device that read the ECG signal from the AD8232 module and displayed the graph on the LCD screen of the ESP32-S3 dev module. But I didn’t want to stop there.
Utilizing WiFi function of ESP32 for real-time monitoring on a web browser
I wanted to take advantage of the ESP32-S3’s Wi-Fi functionality to create a WebSocket server that could communicate with a web browser on a laptop in real time, sending ECG data directly to the browser.
With this new setup, I was able to view the ECG graph on a much larger screen, which made it easier to detect any abnormalities or irregularities in the heart’s electrical activity. Plus, since the data was being sent directly to a web browser, I could use JavaScript to implement more complex features that would have been difficult to achieve on an Arduino.
I added the ability to detect the frequency of the ECG data in Hz and calculate the heart rate via the RR interval. This made it even easier to assess my heart health and identify any potential issues.
Overall, my DIY ECG device was a success, and it allowed me to monitor my heart and get vital data like heart rate measurements, I still needed to wait months for an appointment because when it comes to health we should only rely on experts. Plus, it gave me a deeper understanding of how ECGs work and the technology behind them. While I wouldn’t necessarily recommend building your own medical devices without proper training or supervision, in my case, it was a fun and rewarding project that had some practical applications.
I did a live video on YouTube demonstrating the setup. Although there were not much live participation I welcome comments and questions as well as feedback.