

Low waste data modeling using graph
Hello internet, I decided to write this up after presenting a talk about it to my colleagues at Inviqa recently. I will try to walk you through this mindblowing journey of modeling your data from scratch to building a graphQl API, to consuming the API and then serving it in a ReactJs app.
Prerequisites
- Neo4j DB (Neo4j Desktop) set up locally or use Neo4j sandbox
- NodeJs set up locally
Introduction
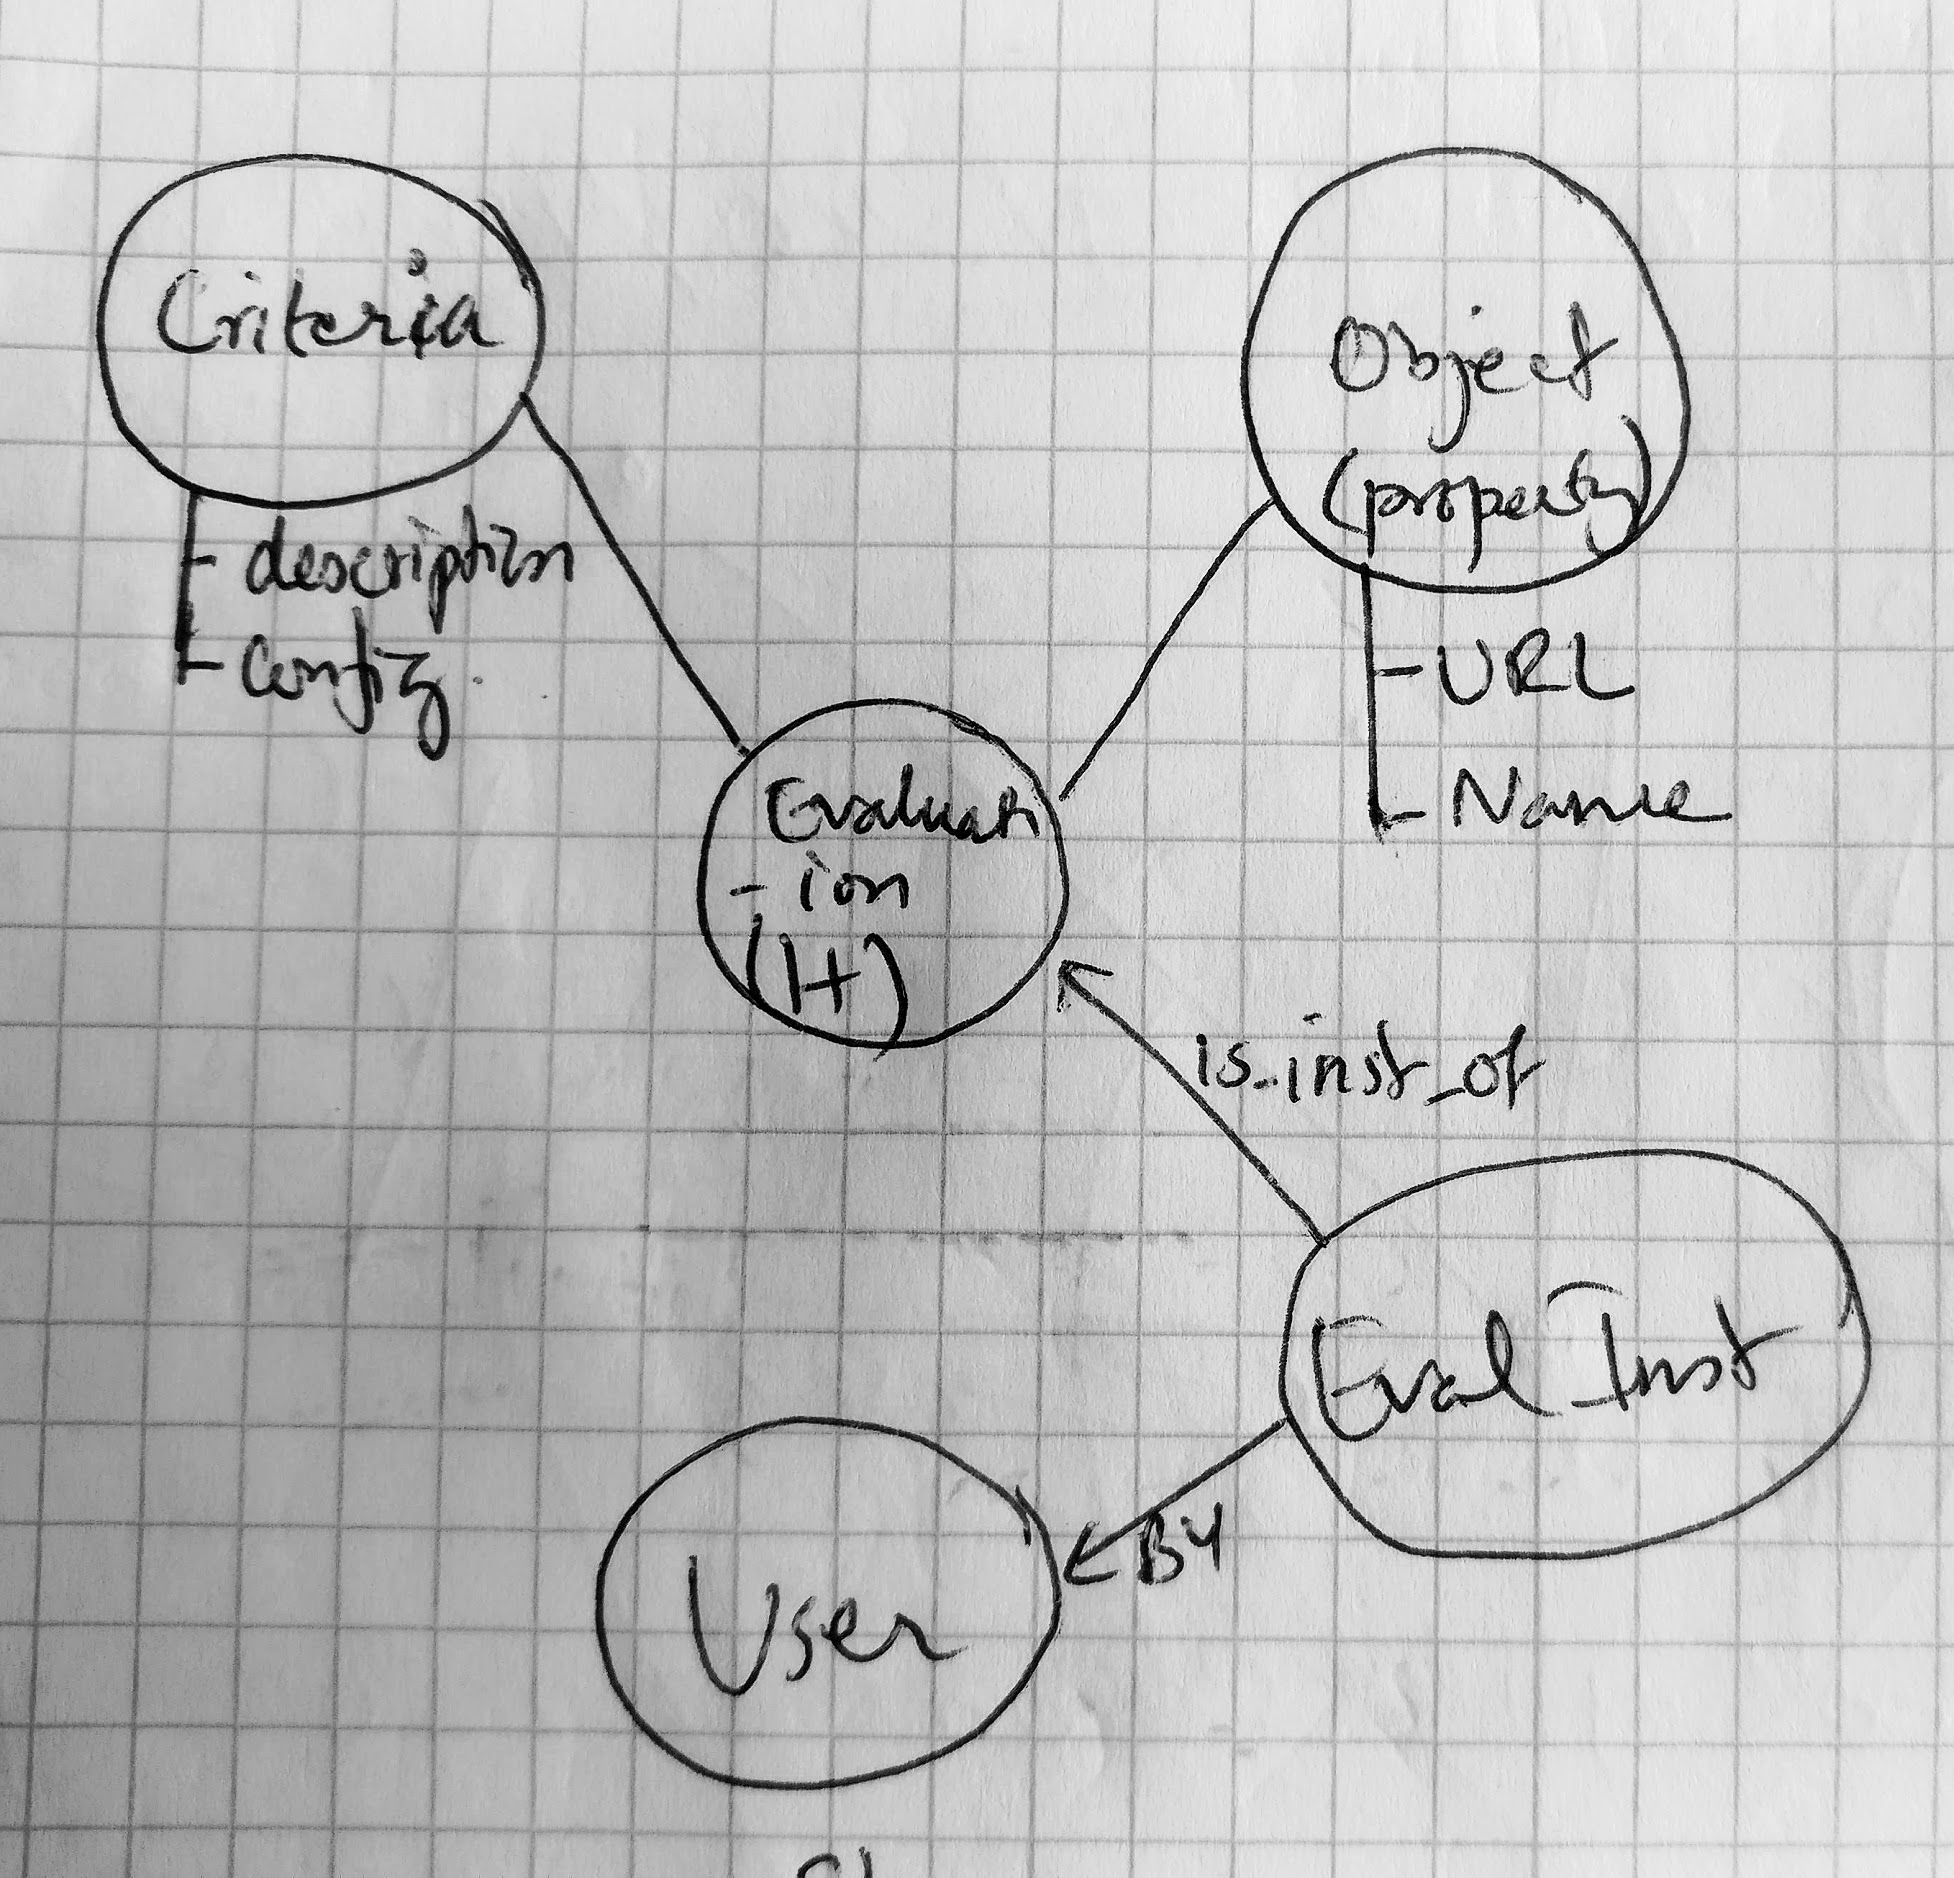
To start any software project, one starts by drawing out what their data look like, usually on a sheet of paper or a drawing tool. However you approach it, the goal is to model your data. You may start with examples and draw a small network of data that can represent the whole database.
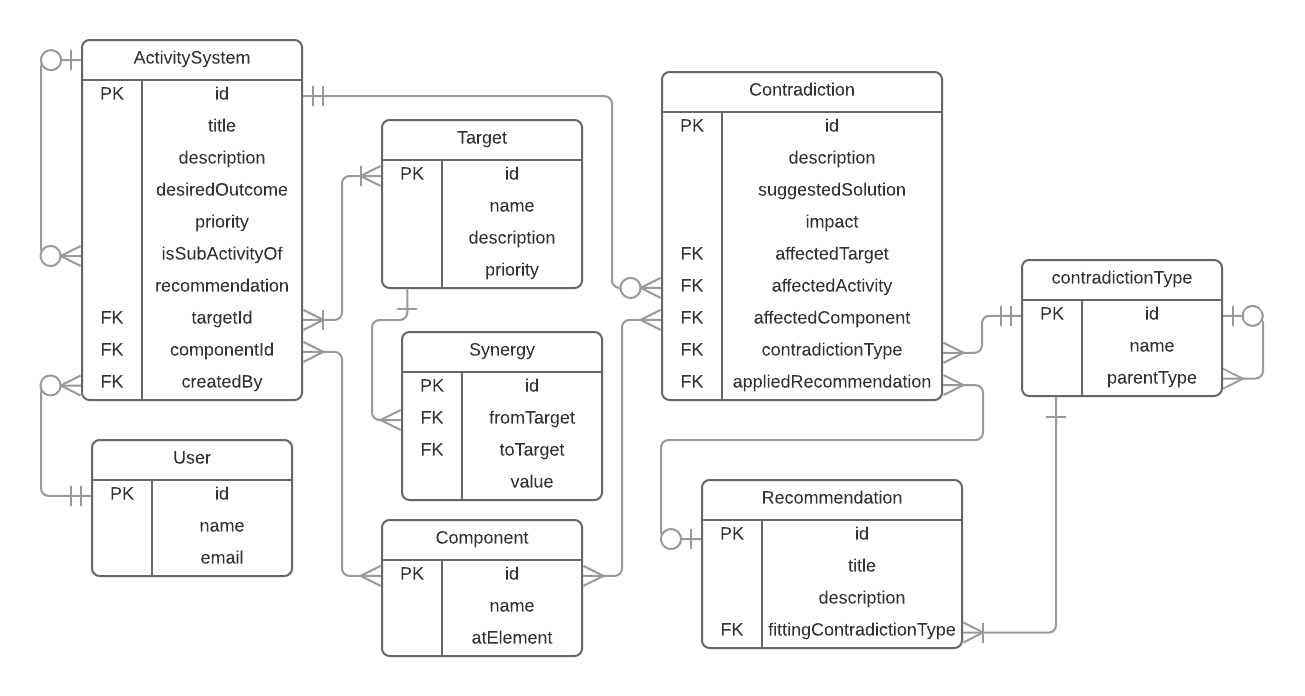
There are several ways of modeling your data. Depending on what kind of database technology you are going to work with. ER diagrams are very commonly used to illustrate data models to be used to build a relational database. Below is an example of an ER diagram, notice primary and foreign keys which are being used to draw relationships between the tables (Entities).
Once you have that visual representation of your database schema, you can then proceed with creating the actual database schema. In SQL databases you will have to set up tables, columns, primary and foreign keys to represent different relationships.
Once the database schema is ready and your database is ready to store your data, you will then need to build a CRUD UI to start populating your data. And depending on your architecture, you might create an API to let a frontend consume your data. REST API is a very popular way of exposing your backend data to your frontend. In recent years GrapQL has gained lots of popularity for several reasons.
Let’s come back to the topic. You might have already wondered why is there “low waste” in the title and what that even means.
Why?
If we go back to the process we described above, The data modeling process produces a graphical representation of your data. Which is consumed by you or a developer visually to manually start writing queries to set up the database, this is a tedious and error-prone process. Once that is done, there is further development work to build an API to expose your database for data consumption.
Modeling your data using a graph can reduce all that effort greatly by converting your whiteboard sketch of your data model to actual data in your database. And then automatically inferring schema out of the same data you just created and then building a graphQl schema (for most cases) without any manual coding. Let’s see it in practice.
Modeling a graph using Arrows
First of all, to model our database (graph) we will use a tool called Arrows. Arrows allows us to visually build graphs. You can create nodes, add relations. You can use labels on the nodes and add type to your relationships, and also lets you use themes to make it look nice. The following graph is the one I created to mimic twitter’s data. You can try it yourself, the tool is very intuitive and easy to use.
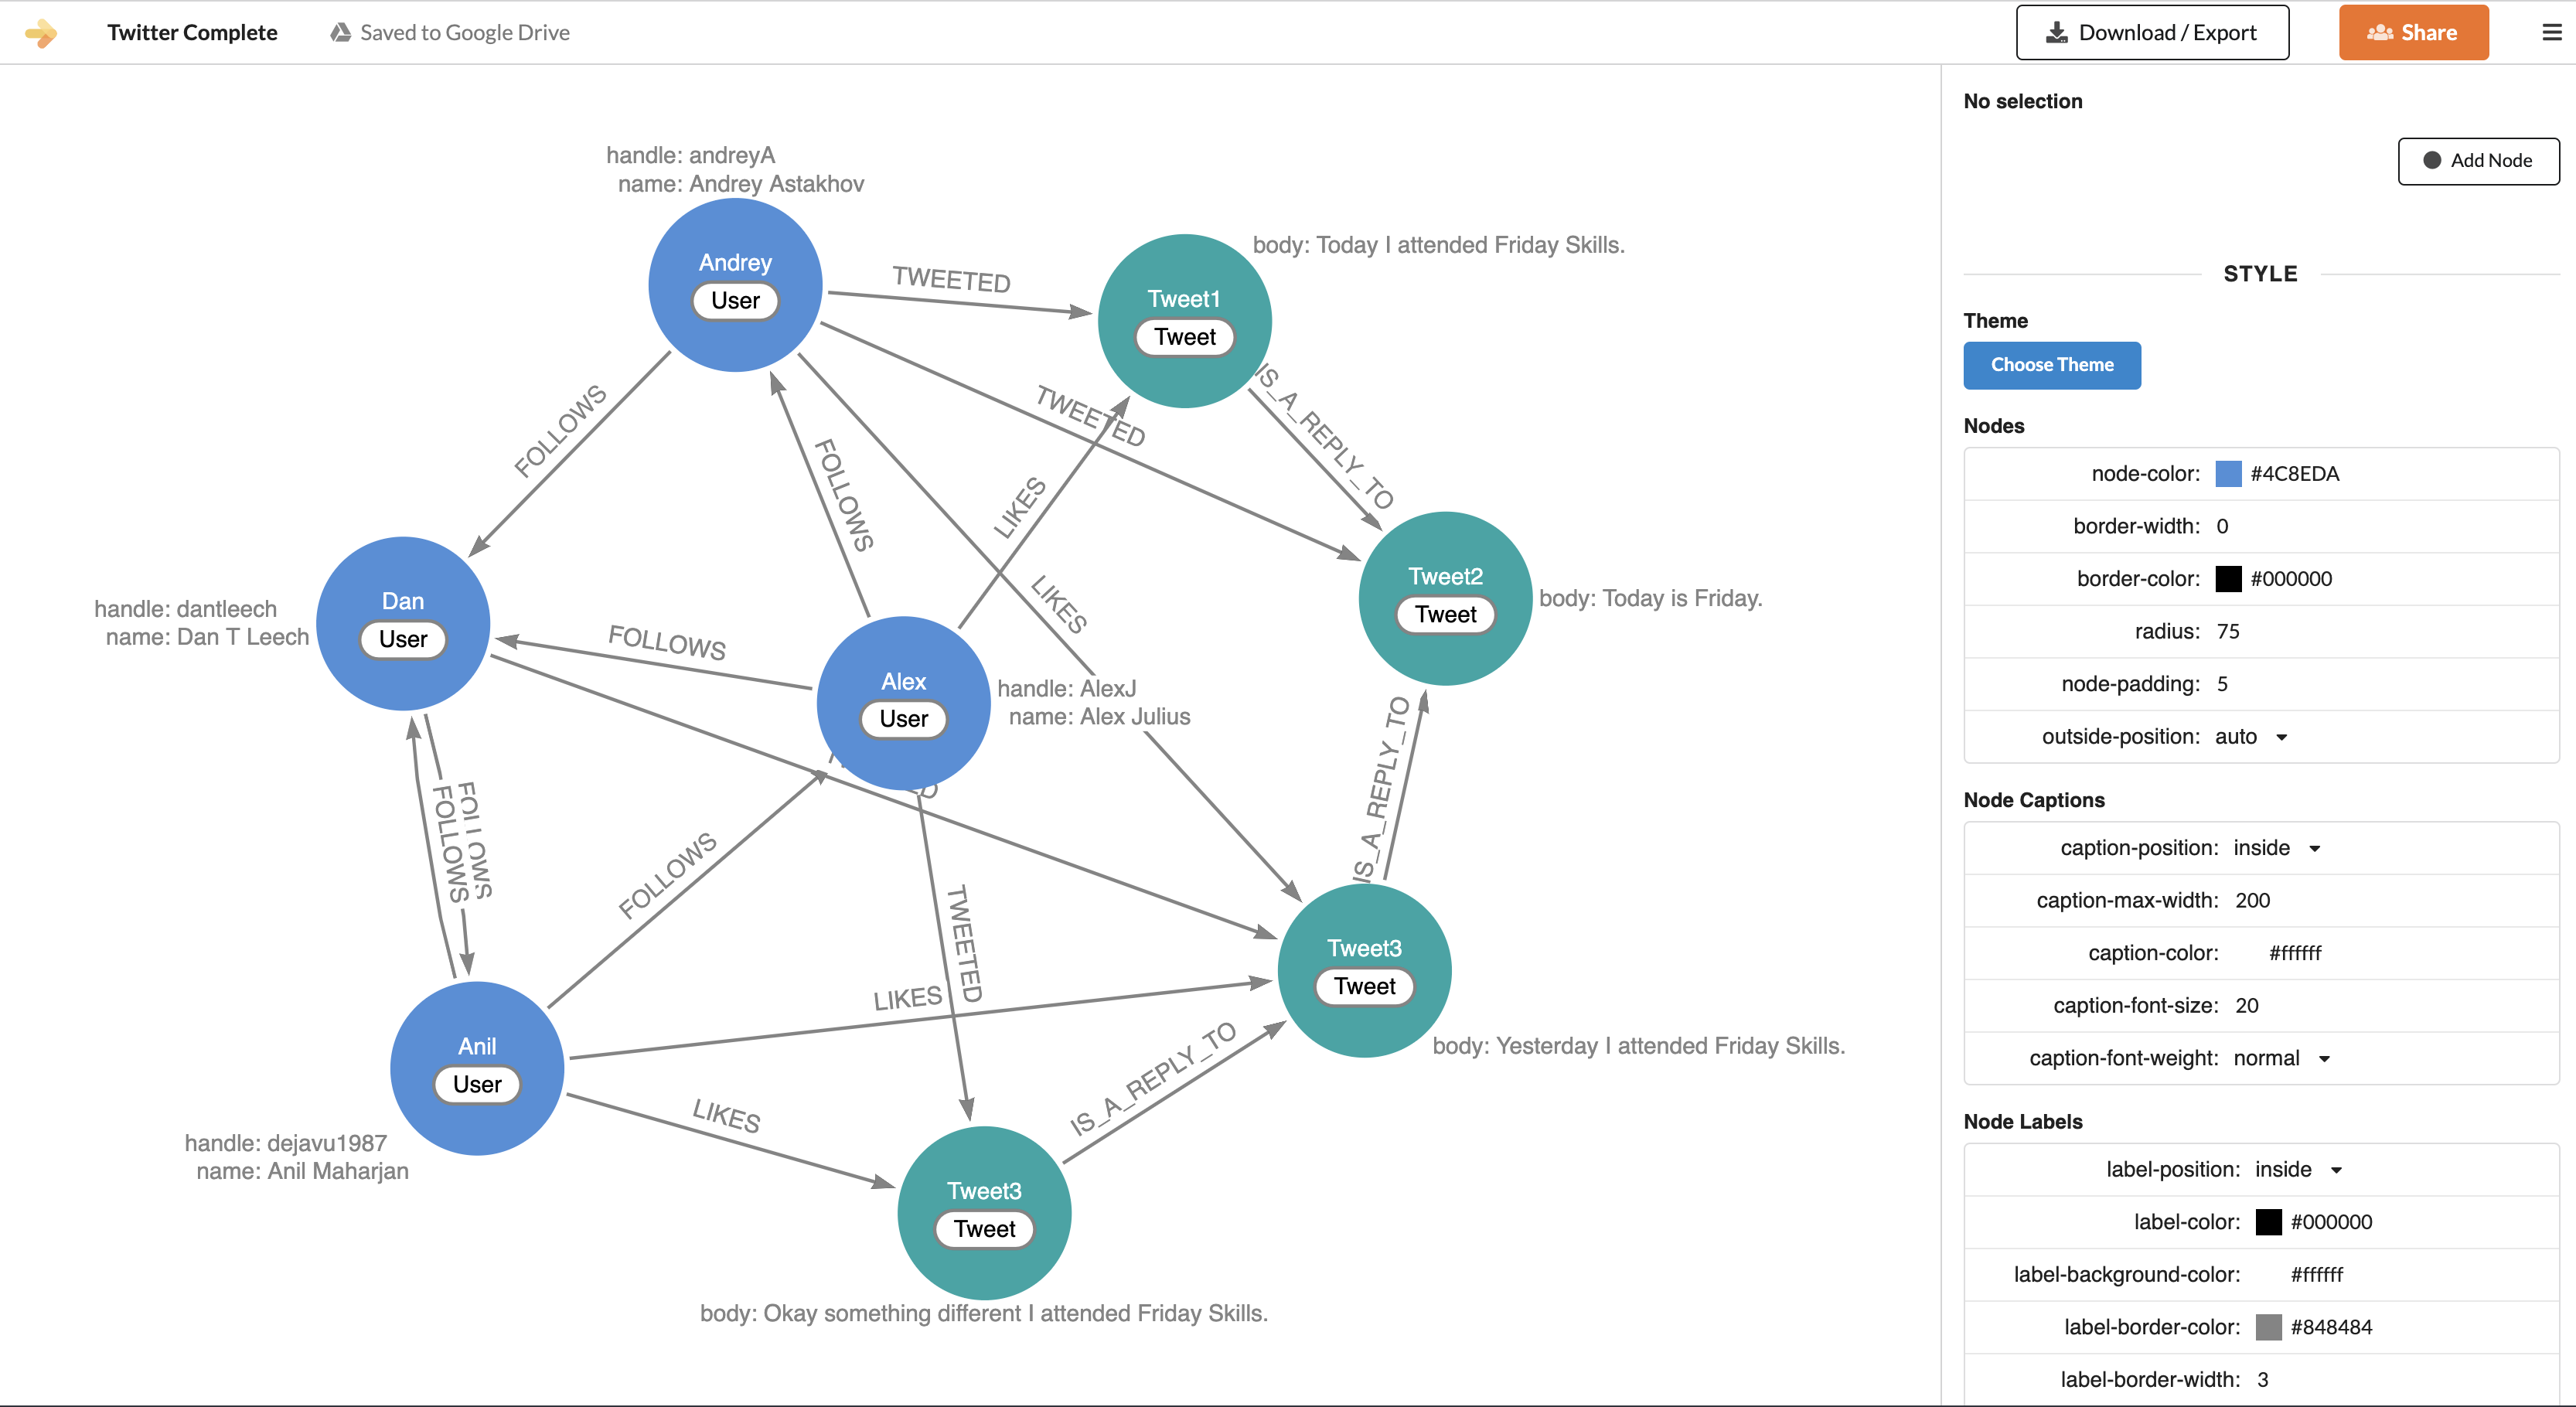
Once we have this graph, we can export it as a Cypher query by clicking on the Download / Export button on the top bar. The query looks something like this.
CREATE
(n6:Tweet {body: "Yesterday I attended Friday Skills."})
<-[:IS_A_REPLY_TO]-
(n7:Tweet {body: "Okay something different I attended Friday Skills."})
<-[:TWEETED]-
(Alex:User {handle: "AlexJ", name: "Alex Julius"})
-[:FOLLOWS]->
(Andrey:User {handle: "andreyA", name: "Andrey Astakhov"})
-[:FOLLOWS]->
(Dan:User {handle: "dantleech", name: "Dan T Leech"})
-[:FOLLOWS]->
(Anil:User {handle: "dejavu1987", name: "Anil Maharjan"})
-[:FOLLOWS]->
(Alex)
-[:FOLLOWS]->
(Dan)<-[:FOLLOWS]-(Anil)-[:LIKES]->(n6)<-[:LIKES]-(Andrey),
(`Tweet2`:Tweet {body: "Today is Friday."})<-[:TWEETED]-(Andrey)
-[:TWEETED]->
(`Tweet1`:Tweet {body: "Today I attended Friday Skills."})-[:IS_A_REPLY_TO]->(`Tweet2`)
<-[:IS_A_REPLY_TO]-(n6),
(Dan)-[:TWEETED]->(n6),
(Anil)-[:LIKES]->(n7),
(Alex)-[:LIKES]->(`Tweet1`)
Populating data to Neo4j database
The exported Cypher query can be executed on your Neo4j browser. Neo4j browser is a web-based UI to access your Neo4j database. It allows you to run queries and visualize results in graph diagrams. Once you run your query by entering it to the Query textarea on the top of Neo4j Browser, you will see a message saying something like:
Added 8 labels, created 8 nodes, set 12 properties, created 17 relationships, completed after 252 ms.
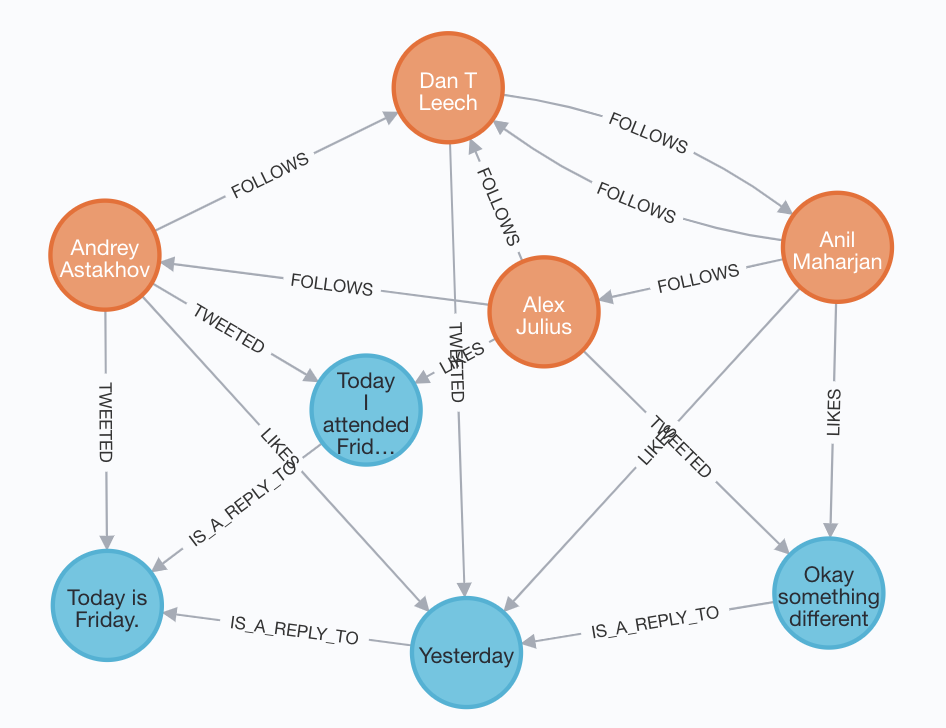
With that your database with the data from the graph you drew before is ready. You can check by querying for everything in your database by executing.
match (n) return n
The result should look something like following
Setting up a Backend
To set up a graphQl API, you will need nodejs in your system. You will need few npm modules to set your GraphQl API server up.
- apollo-server-express
- express
- neo4j-driver
- neo4j-graphql-js
First of all create a folder in your filesystem to host your GraphQl API project. Inside the project initialize npm by running,
npm init
Enter appropriate values when asked.
then install all the dependencies to your project by running
npm install apollo-server-express express neo4j-driver neo4j-graphql-js
Inferring GraphQl typedefs from Graph Database
Then inside the same directory create a script to infer typedefs from your Neo4j database and save it as schema.graphql
const neo4j = require('neo4j-driver')
const { inferSchema } = require('neo4j-graphql-js')
const fs = require('fs')

const driver = neo4j.driver(
  'bolt://localhost:7687', // url to sandbox if its not on your local
  neo4j.auth.basic('DB_NAME', 'YOUR_PASS')
)

const schemaInferenceOptions = {
  alwaysIncludeRelationships: true,
}

inferSchema(driver, schemaInferenceOptions).then((result) => {
  fs.writeFile(__dirname + '/schema.graphql', result.typeDefs, (err) => {
    if (err) throw err
    console.log('Updated schema.graphql')
    process.exit(0)
  })
})
To run this script, save it as inferSchema.js and then from your command line from the same directory , run
node ./inferSchema.js
This will print Updated schema.graphql on the console and create a file called schema.graphql.
Running a GraphQl server using ApolloServer
This schema.graphql file will be required by ApolloServer to create a GraphQl endpoint for us. The following code will run an Apollo server with graphQl endpoint and a GraphQl Playground, a web-based UI to query your database as well as the place where you can find complete documentation of your database schema.
import { ApolloServer } from 'apollo-server-express'
import express from 'express'
import neo4j from 'neo4j-driver'
import { makeAugmentedSchema } from 'neo4j-graphql-js'

import fs from 'fs'
import path from 'path'

export const typeDefs = fs
  .readFileSync(path.join(__dirname, 'schema.graphql'))
  .toString('utf-8')


const app = express()


const driver = neo4j.driver(
  'bolt://localhost:7687',
  neo4j.auth.basic(
    'neo4j',
    'YOUR_PASSWORD'
  )
)

const augmentedSchema = makeAugmentedSchema({ typeDefs })

const server = new ApolloServer({
  context: {
    driver,
    driverConfig: { database: YOUR_DATABASE },
  },
  schema: augmentedSchema,
  introspection: true,
  playground: true,
})

// Specify host, port and path for GraphQL endpoint
const port = process.env.GRAPHQL_SERVER_PORT || 4001
const path = process.env.GRAPHQL_SERVER_PATH || '/graphql'
const host = process.env.GRAPHQL_SERVER_HOST || '0.0.0.0'

server.applyMiddleware({ app, path })

app.listen({ host, port, path }, () => {
  console.log(`GraphQL server ready at http://${host}:${port}${path}`)
})
Save this snippet as index.js and run it via
node .
The url to the playground should appear on the terminal. go to the URL and you must see the GraphQL playground UI.
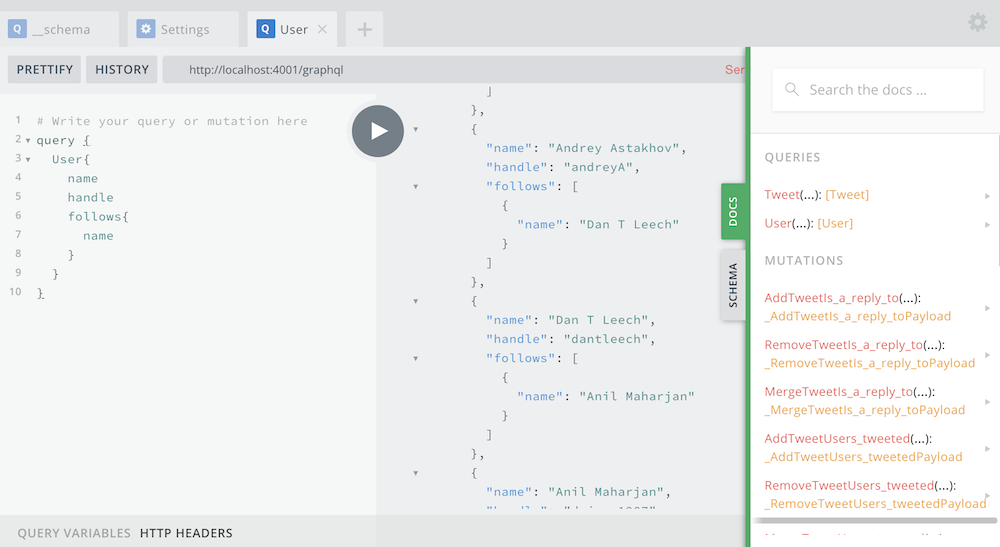
To test you can run following graphQl query to retrieve Users and their properties
query {
  User{
    name
    handle
    follows{
      name
    }
  }
}
ReactJs Frontend to consume the GraphQl data
From this point, you are free to choose whichever frontend you want to use to create the UI.
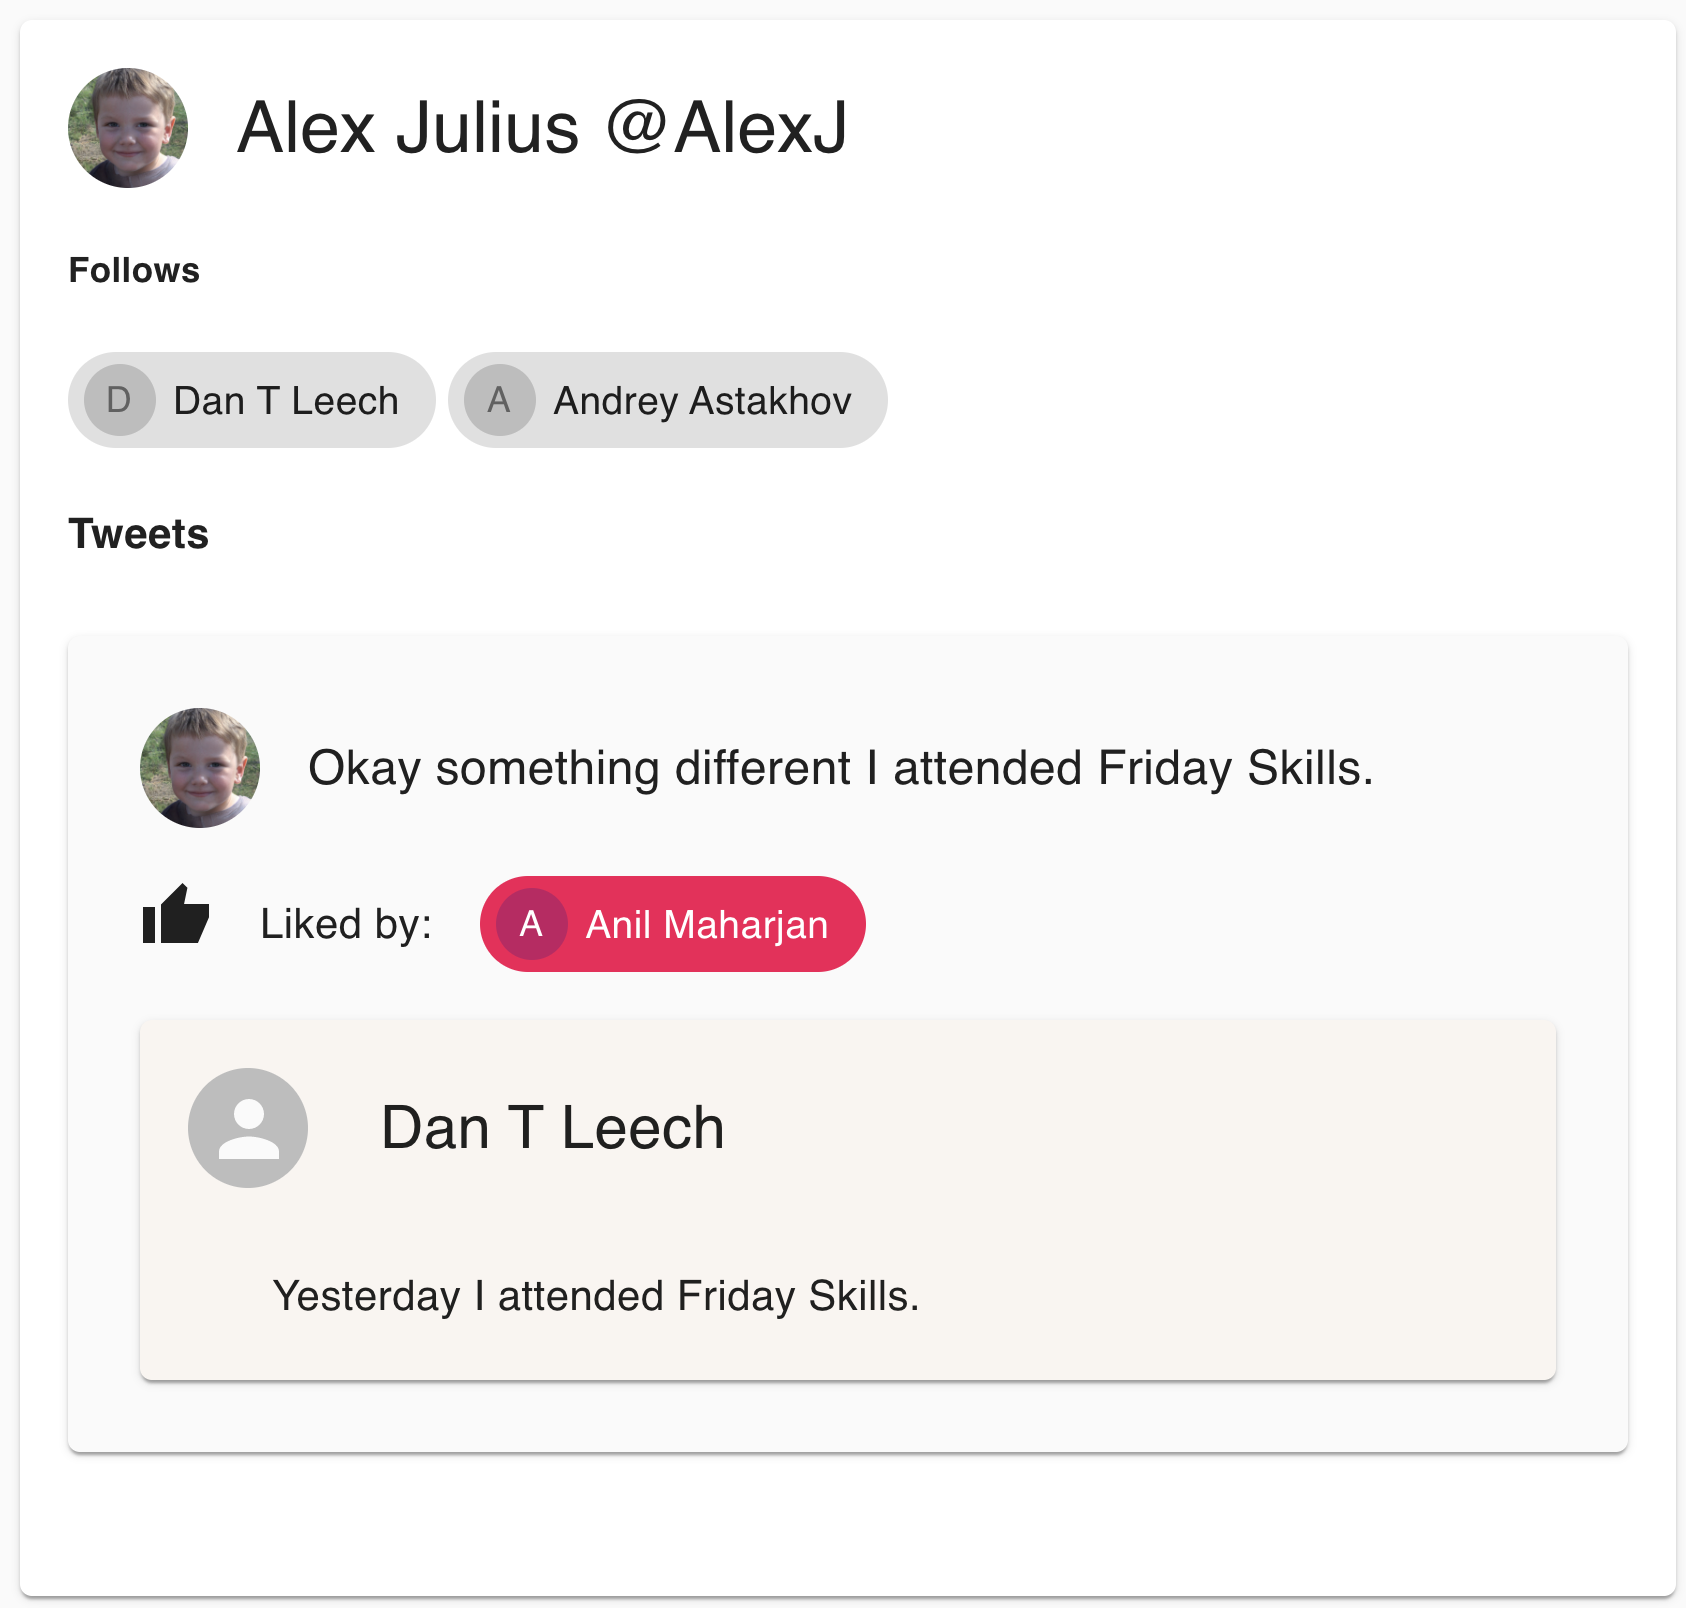
I have created a small ReactJs component to render the list of our Twitter users and show their, data, like follows, tweets, likes, and replies on them.
Conclusion
Data modeling is one of the most important parts of a project life cycle. Compared to other traditional ways of modeling data, data modeling with graphs is easy, fun, and intuitive. With the right tools, it’s fairly easy to start a full-stack PoC without having to write too much code. I believe, persons with different roles like Product Owners or Business analysts with a very basic knowledge of programming with Javascript, can leverage this and do awesome things without having to rely on development teams, or team up with them to get an even greater outcome. 🙂